Load CSV Exercise for Traffic Volume and Iris Data
Metro Interstate Traffic Volume Data Set
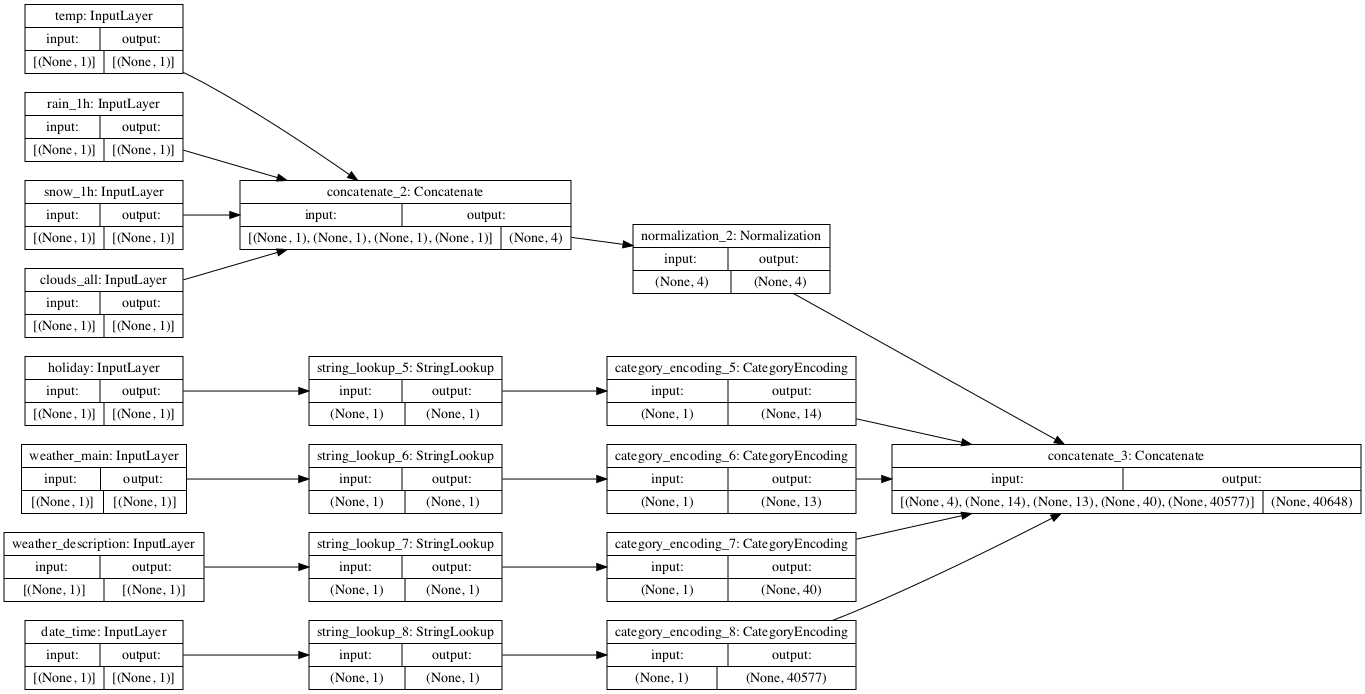
When I ran the titanic code that we previously developed for the traffic volume dataset, I got some interesting results. I only changed 2 things in the code - the link to the dataset, and the variable to pop (which was ‘traffic_volume’). This is what my input preprocessing model looks like:

I can see that it is taking all the numerical inputs and combining them. Later on, it takes the string inputs, and converts them into numerical inputs, and then combines all the inputs to make the model. There are different ways to reach the conclusion, based on if you start with a string input or a numerical input.
When I fit this model, I was surprised to see that my loss was negative.
Epoch 10/10
1507/1507 [==============================] - 19s 12ms/step - loss: -226190576.0000
The loss is over -226,000,000. This was really strange, so I decided to change the popped variable to see if I could make it any better. I changed it to ‘weather_main’, but was unable to get the model to run. This is because the model is trying to predict a string value by coming up with floats, which is not possible to do.
So then, I tried a numerical value - ‘rain_1h’ as my popped variable.
Epoch 10/10
1507/1507 [==============================] - 17s 11ms/step - loss: -39.9785
This definitely improved the loss values.
Iris Dataset
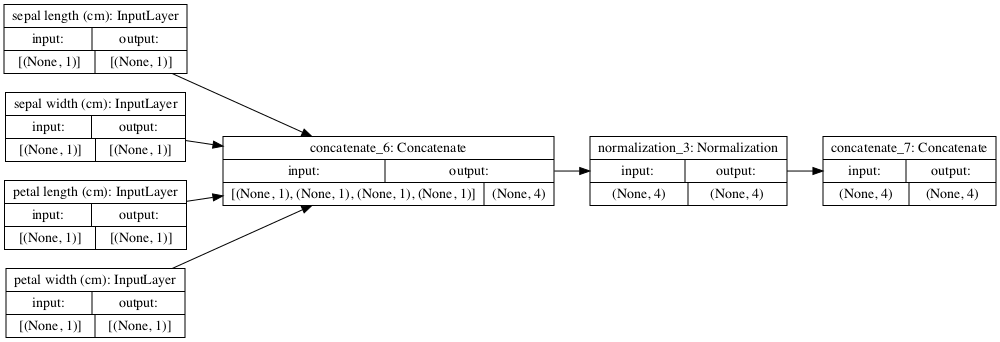
In the case of the Iris dataset, all the variables were numeric, even the target (0, 1, 2 each corresponded to a different flower). So the model chart looks a bit different from the Metro dataset.

One thing that I noticed is that in both images, only the numerical values go through normalization. Normalization is used to recenter and rescale the data, which makes sense since some numerical features are on different scales than others.
My loss for the iris data was also negative, but it took a shorter amount of time for the fitting to run, which was probably due to the smaller amount of steps per epoch.
Epoch 10/10
5/5 [==============================] - 0s 857us/step - loss: -0.9684
The loss is the smallest loss out of the two (three if you are including the ‘rain_1h’ loss) losses that I have gotten. I’m not sure of the significance of negative losses. Could they mean that the model is performing well, perhaps too well?